
Instagram/Facebook Reels Retention Benchmarks
There is no single official Instagram or Facebook Reels retention benchmark in the Meta sources reviewed for this guide. If you build software and publish Reels, mixing seconds, percentages, denominators, windows, or paid scope can make an invalid comparison look decisive. Meta defines watch-time metrics and supplies retention tools, but it does not publish one platform-wide percentage or number of seconds that every Reel should beat.
Use external averages as context, not targets. Compare each Reel with a like-for-like account baseline: the same platform, reporting window, paid or organic scope, duration band, and metric denominator. In the supplied three-post case, paid distribution dominates Instagram, Facebook’s largest displayed drops happen within two seconds, and mismatched Instagram watch-time fields prevent a clean performance verdict.
This guide separates published facts, screenshot observations, arithmetic, and interpretation so you can decide what to test next without inventing a benchmark.
No universal official Reels retention benchmark appears in the reviewed Meta sources
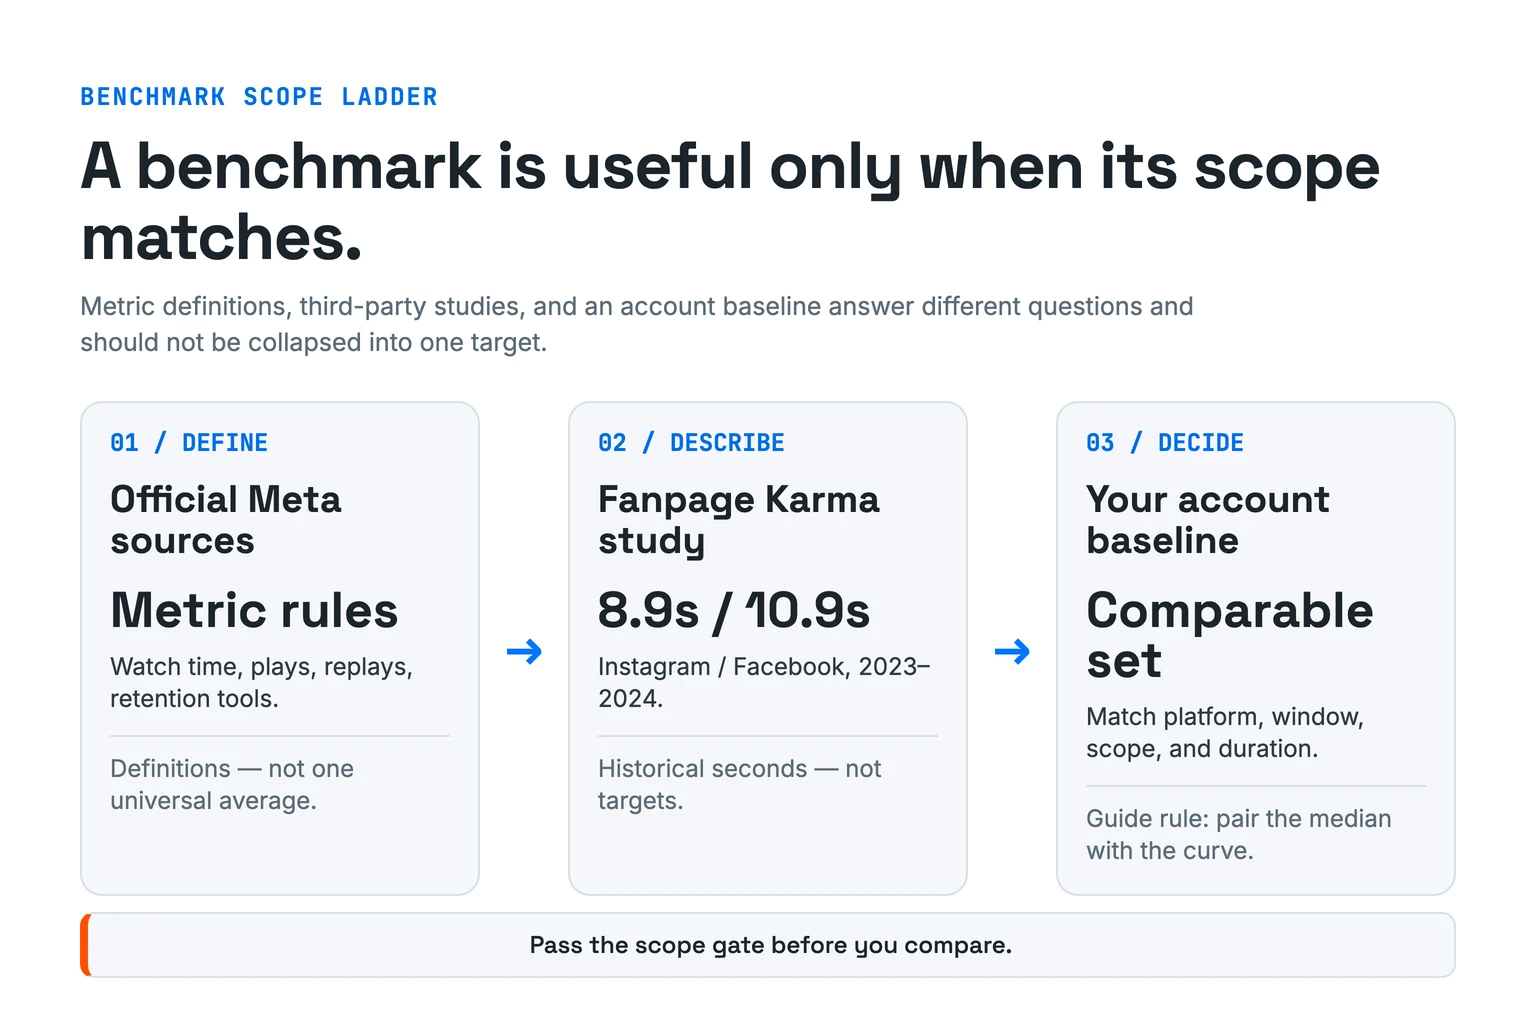
The official sources explain how to read metrics, not what score counts as universally good. In April 2023, Meta defined Instagram total watch time and average watch time. Total watch time includes replay time. Average watch time equals total watch time divided by total plays. In November 2023, Meta said Reels Plays include Initial Plays and Replays and announced a moment-by-moment retention chart.
The Facebook announcement is similar. Meta described Facebook retention graphs that show how long viewers watched, alongside reach, interactions, follower attribution, and distribution health. None of those reviewed announcements provides one Instagram- or Facebook-wide average.
That absence matters because a universal target would collapse different Reel lengths, audiences, distribution modes, account sizes, and denominators. A 6-second loop and a 60-second explanation can have the same average watch time while producing very different viewing behavior.
The transparent third-party average is context, not a target
Fanpage Karma offers a useful historical reference because it publishes its sample and period. Its 2024 study covered 419,393 Instagram Reels from 1,088 accounts and 246,366 Facebook Reels from 998 accounts, posted from August 2023 through July 2024. It reported average viewing times of 8.9 seconds on Instagram and 10.9 seconds on Facebook.
Those values still are not universal retention benchmarks. Fanpage Karma’s study does not give a Reel-duration distribution or a length-normalized percentage in the selected methodology. It also does not supply enough account-selection, paid-scope, or uncertainty detail to turn either mean into an AI Maker Lab target.
A second benchmark source demonstrates the scope problem from another angle. Dash Social’s 2026 Instagram Reels benchmark uses 3.3K+ global brands from July through December 2025. It covers handles with at least 1,000 followers and organic, boosted, and promoted content while excluding ads. It reports industry engagement rates from 0.1% to 0.5%, calculated as engagement divided by views. That is an engagement benchmark, not retention. Its no-ads scope does not match the ad-dominated case below.
Reels retention metrics answer different questions
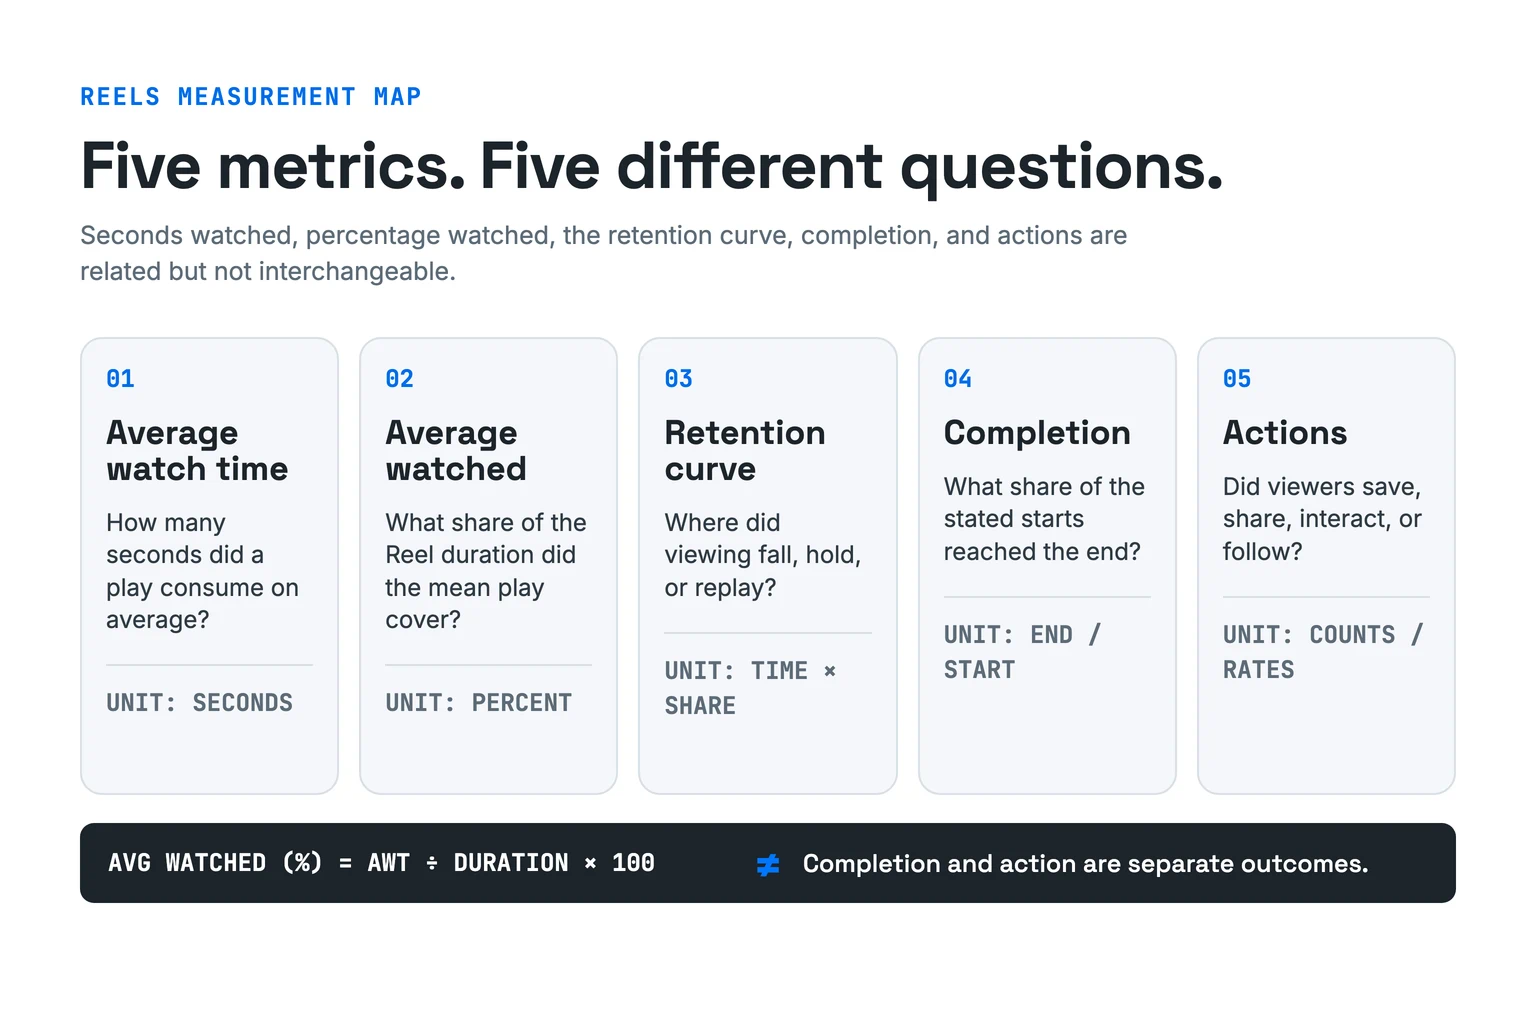
Read each metric as an answer to one question. Do not substitute a percentage for seconds, a curve for completion, or a view count for an action.
On a narrow screen, scroll the metric table horizontally.
| Metric | Unit or formula | Question it answers | Common mistake |
|---|---|---|---|
| Total watch time | Seconds or minutes, including replay time under Meta’s 2023 Instagram definition | How much playback time accumulated? | Comparing totals across different play counts |
| Average watch time (AWT) | total watch time ÷ total plays under Meta’s published Instagram definition | How many seconds did a play consume on average? | Treating seconds as a completion percentage |
| Average watched | AWT ÷ Reel duration × 100 as a derived normalization | What share of the Reel duration did the mean play cover? | Calling the result a completion rate |
| Retention curve | Viewer share plotted against elapsed time | Where did viewing fall, hold, or replay? | Reducing the curve to one average |
| Completion rate | completed eligible plays ÷ eligible starts × 100, using the export’s stated denominator | What share of defined starts reached the end? | Inventing completions from average watched |
| Three-second View Rate | Percentage continuing after three seconds in the reported Instagram feature | Did the opening retain the metric’s defined audience past three seconds? | Treating three-second views as a rate without starts |
| Views | Plays or views under the export’s stated definition | How much playback occurred? | Treating a replay-inclusive view as a unique person |
| Interactions, saves, shares, follows | Counts or rates with an explicit denominator | What action occurred after exposure? | Treating engagement as buyer intent or demand |
The average-watched formula is useful for comparing different durations, but it is an operational normalization—not an official universal target. Because Meta’s published total watch time includes replay time, a replay-heavy Reel can also complicate a simple duration-normalized reading.
Completion stays separate. If a platform export does not provide completed plays and its denominator, do not manufacture completion from AWT or average watched. Likewise, a count of three-second views is not a three-second rate until you also know the eligible starts.
TechCrunch reported in January 2025 that Instagram’s View Rate shows the percentage of followers and non-followers continuing after three seconds. It also described Views Over Time, which compares accumulated views with an account’s usual views over the same period. That report is dated and secondary, so verify the current in-product label before building an automated scorecard around it.
The three-post case shows paid scope and an opening question
The supplied screenshots cover three posts: Game grammar, Platformer, and Translation hooks. Their strongest signal is not a universal creative winner. It is a measurement warning: Instagram distribution is mostly classified as ads, Facebook shows early drop points, and several fields lack compatible denominators.
Instagram is primarily a paid-distribution case
On a narrow screen, scroll the Instagram comparison table horizontally.
| Post | Top-line views | Reach: organic + ads | Source-classified views: organic + ads | Interactions | Total watch time | Reported AWT | Follows |
|---|---|---|---|---|---|---|---|
| Game grammar | 757 | 50 + 1,505 | 62 + 692 | 4 | 9m21s | 8s | 0 |
| Platformer | 425 | 121 + 884 | 138 + 287 | 3 | 7m24s | 3s | 0 |
| Translation hooks | 127 | 12 + 374 | 14 + 113 | 2 | 2m6s | 8s | 0 |
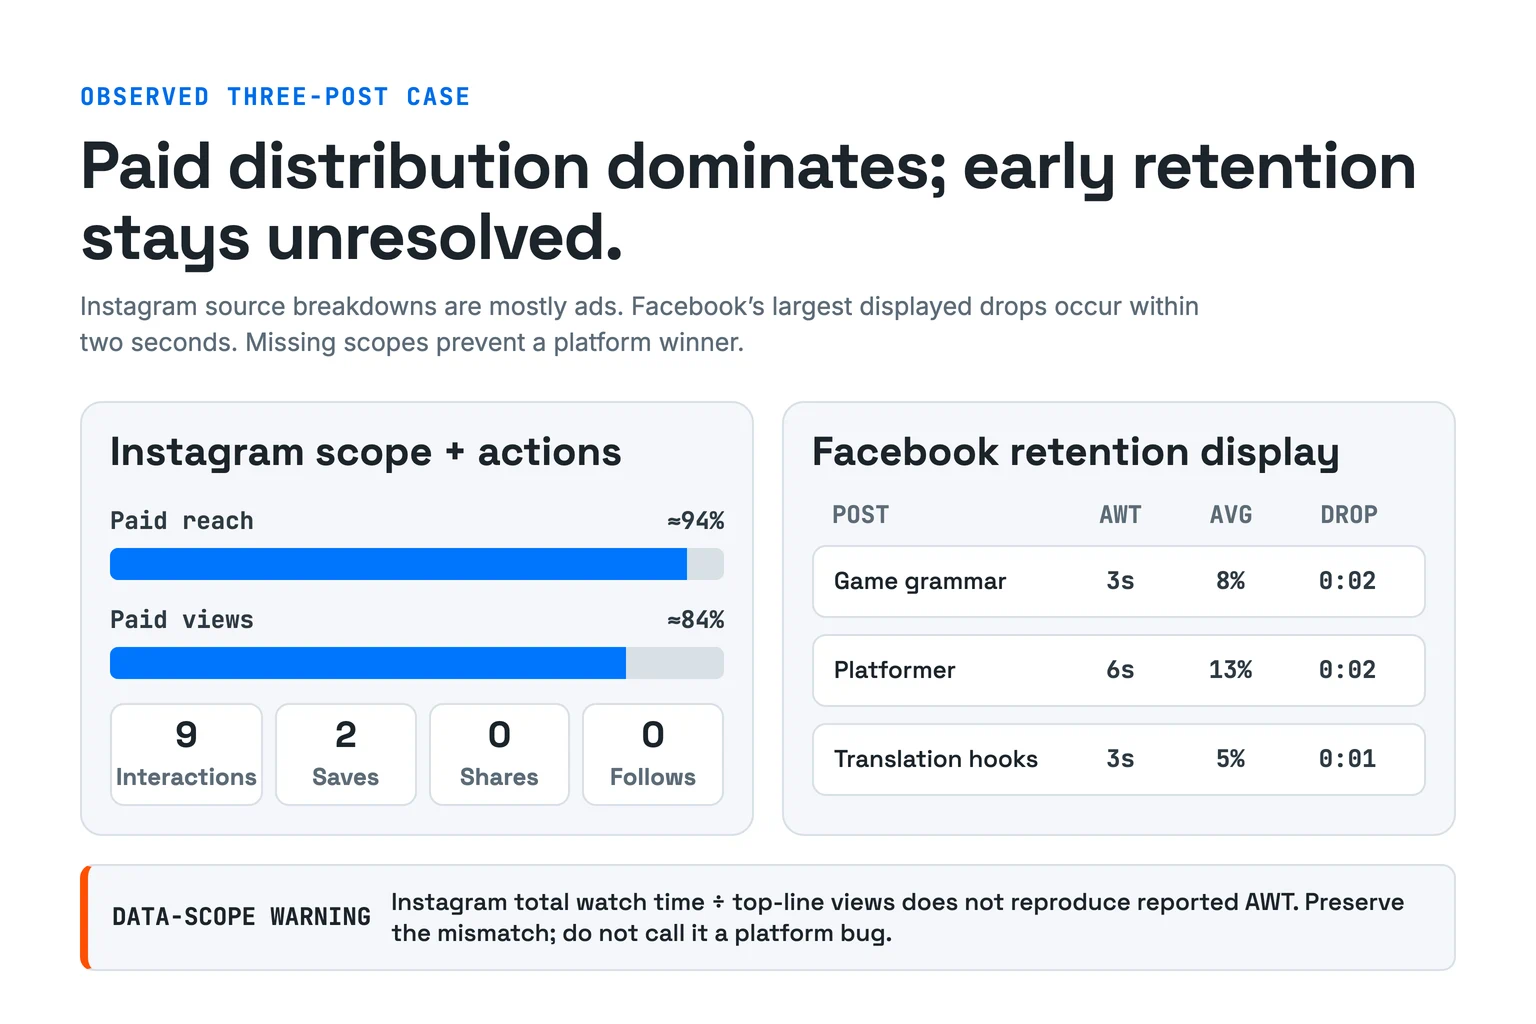
Across the classified Instagram reach values, ads account for 2,763 ÷ 2,946, or about 94%. Across source-classified views, ads account for 1,092 ÷ 1,306, or about 84%. These are shares of the supplied classified values, not claims about the whole account or Instagram generally.
The source-classified views total 1,306, while top-line views total 1,309. Preserving that three-view difference is safer than silently forcing the fields to match. The screenshots also show 9 interactions, 2 saves, 0 shares, and 0 follows across the three posts.
Those action counts do not establish audience quality, buyer intent, product demand, or conversion. They also do not prove the posts failed. Without aligned reporting windows, impression or reach denominators, objectives, and a comparable baseline, they are bounded observations.
The Instagram AWT fields need a scope warning
The displayed total-watch-time and AWT fields do not reconcile under Meta’s published formula when top-line views are used as plays.
On a narrow screen, scroll the watch-time reconciliation table horizontally.
| Post | Displayed total watch time in seconds | Top-line views | watch seconds ÷ views | Displayed AWT |
|---|---|---|---|---|
| Game grammar | 561 | 757 | 0.74s | 8s |
| Platformer | 444 | 425 | 1.04s | 3s |
| Translation hooks | 126 | 127 | 0.99s | 8s |
The calculation exposes non-comparability; it does not prove a Meta bug. Views may not equal the plays used by the AWT formula. The screenshots may also represent different windows, audience slices, attribution scopes, or product surfaces. The correct next step is to export the native fields with their date ranges and definitions, then reconcile the scopes before judging performance.
Facebook points to an early-drop test, not a winner
On a narrow screen, scroll the Facebook comparison table horizontally.
| Post | AWT | Average watched | Three-second views | Biggest drop |
|---|---|---|---|---|
| Game grammar | 3s | 8% | 2 | 0:02 |
| Platformer | 6s | 13% | 2 | 0:02 |
| Translation hooks | 3s | 5% | 4 | 0:01 |
Platformer has the highest displayed Facebook AWT and average watched inside this three-post set: 6 seconds and 13%. That makes it the leading descriptive row for those two fields, not a proven winning creative. Durations, starts, paid scope, reporting windows, and randomized assignment are missing.
Translation hooks has the most displayed three-second views, 4, but the lowest average watched, 5%, and the earliest biggest drop, 0:01. Without a start denominator, four three-second views cannot be interpreted as a better three-second rate.
Every displayed biggest drop occurs within the first two seconds. That makes the opening a reasonable next test area. The screenshots do not show the drop magnitude or curve denominator, so they cannot tell us how many viewers left or which exact edit caused it.
Build a comparable account scorecard
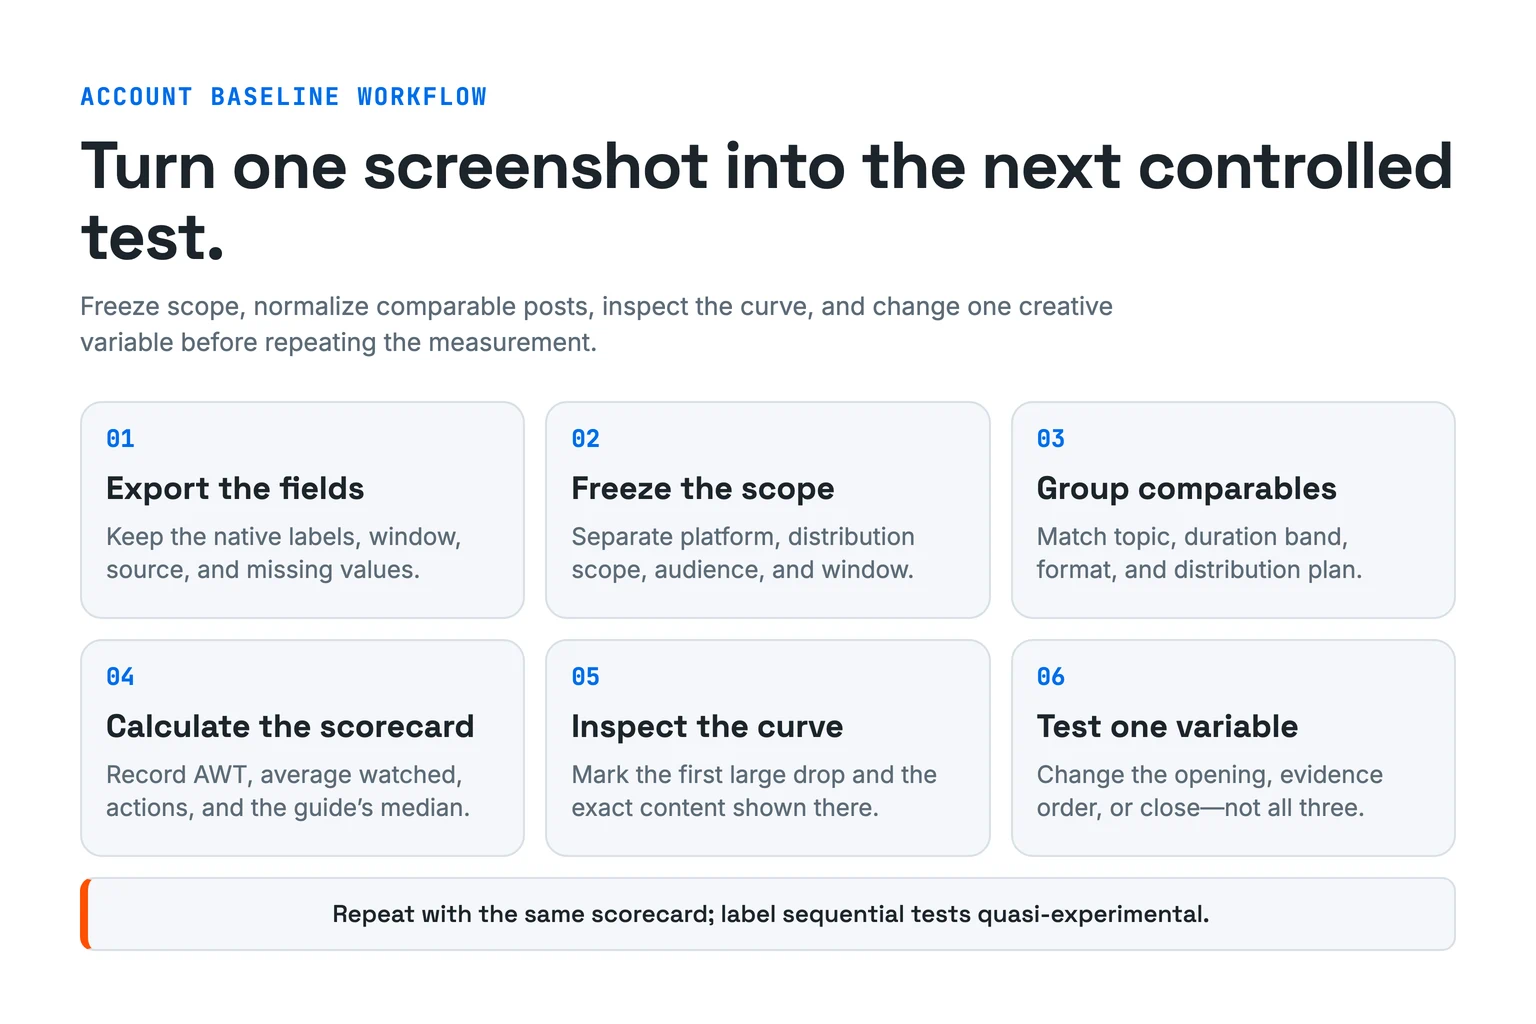
A practical benchmark starts with a frozen comparison contract. Export every Reel in a fixed analysis window, then keep only rows that match the comparison you intend to make. This guide’s analysis rule is to report the sample size and never treat a small set’s median as stable.
Use one row per Reel with these fields:
| Scorecard field | Record exactly |
|---|---|
| Identity | Post URL or id, final asset hash/version, caption version |
| Scope | Platform, account, organic/boosted/promoted/ads, follower/non-follower slice |
| Window | Publish time, observation cutoff, attribution/reporting date range |
| Creative | Topic, duration, hook family, frame-zero subject, CTA, audio treatment |
| Distribution | Views/plays, reach, impressions when available, paid spend and targeting when applicable |
| Retention | Total watch time, AWT, average watched, three-second starts/rate, completion when supplied, first major curve drop |
| Actions | Interactions, likes, comments, saves, shares, follows, profile visits, link actions when intentionally measured |
| Limits | Missing denominators, field mismatch, UI definition, anomalous delivery, unresolved data scope |
Then calculate account baselines only inside comparable groups. For this guide, record the median as a consistent summary convention and label the sample size; do not claim robustness or stability for a small set. Keep AWT and average watched together: seconds preserve absolute attention, while the percentage controls for duration. Inspect the retention curve beside both because one mean cannot show whether the loss occurred at frame zero, mid-explanation, or after the payoff.
Test one creative variable at a time
The next experiment should be narrow enough to interpret. For these screenshots, the observed Facebook drop points make an opening test more defensible than a total rewrite.
Write the experiment before publishing either version:
- Question: Does a concrete frame-zero problem state hold more viewers through the opening than the current opening?
- Primary metric: Choose one available opening measure, such as a reported three-second View Rate or retention at a fixed timestamp.
- Guardrails: Keep AWT, average watched, and downstream actions visible so a stronger opening does not hide a weaker payoff.
- Changed variable: Change only the opening claim, first frame, or opening evidence order.
- Held conditions: Keep platform, duration band, audience/distribution plan, observation window, and CTA as comparable as practical.
- Identity: Freeze the exact video, caption, cover, and measurement cutoff used for each row.
- Interpretation: Call a sequential platform-distributed comparison quasi-experimental unless the platform randomizes assignment for the tested surface.
A single comparison should update the next hypothesis, not become a universal rule. Repeat the same scorecard across comparable Reels before promoting an account observation into an operating target.
What this analysis establishes
The research establishes four bounded conclusions:
- The reviewed Meta sources do not publish one universal Reels retention average.
- The Fanpage Karma seconds are historical sample means rather than targets.
- The supplied Instagram case is paid-dominated and arithmetically scope-mismatched.
- The Facebook screenshots justify testing the opening without naming a causal winner.
The analysis does not establish buyer intent, demand, conversion, an algorithm threshold, or a platform defect. It also cannot compare Instagram and Facebook directly until duration, reporting window, distribution scope, starts, and denominators align.
For the next controlled test, adapt one evidence-bounded opening with our Instagram Reel hooks guide and record it with the scorecard above.
Sources
- Meta Newsroom. “New Features on Instagram Reels: Trends, Editing and Gifts”. Published 2023-04-14; page updated 2023-10-19. Total and average watch-time definitions. Accessed 2026-08-26.
- Meta Newsroom. “New Ways to Create Content on Instagram”. Published 2023-11-15. Initial Plays, Replays, and retention-chart announcement. Accessed 2026-08-26.
- Meta Newsroom. “Helping Creators Get Discovered and Earn Money on Facebook”. Published 2023-06-14; page updated 2024-02-29. Facebook retention-graph and insight-surface announcement. Accessed 2026-08-26.
- Fanpage Karma Insights. “Short Video Insights: Which Platform Generates the Best Results for Brands?”. Published 2024-09-25; page metadata updated 2025-11-27. Historical third-party sample and viewing-time means. Accessed 2026-08-26.
- Dash Social, Jamie Landry. “Instagram Reels Stats and Performance Benchmarks By Industry”. Published 2026-06-05. Commercial brand sample, engagement definitions, and scope. Accessed 2026-08-26.
- TechCrunch, Aisha Malik. “Instagram gives creators more insight into their reels’ performance”. Published 2025-01-29. Secondary report on View Rate and Views Over Time. Accessed 2026-08-26.
- AI Maker Lab account owner. Human-supplied Instagram and Facebook screenshots transcribed on 2026-08-26. Screenshot capture dates, reporting windows, Reel durations, and native exports were not supplied.