
Rain at 94% dry grip, and a parked car that crept
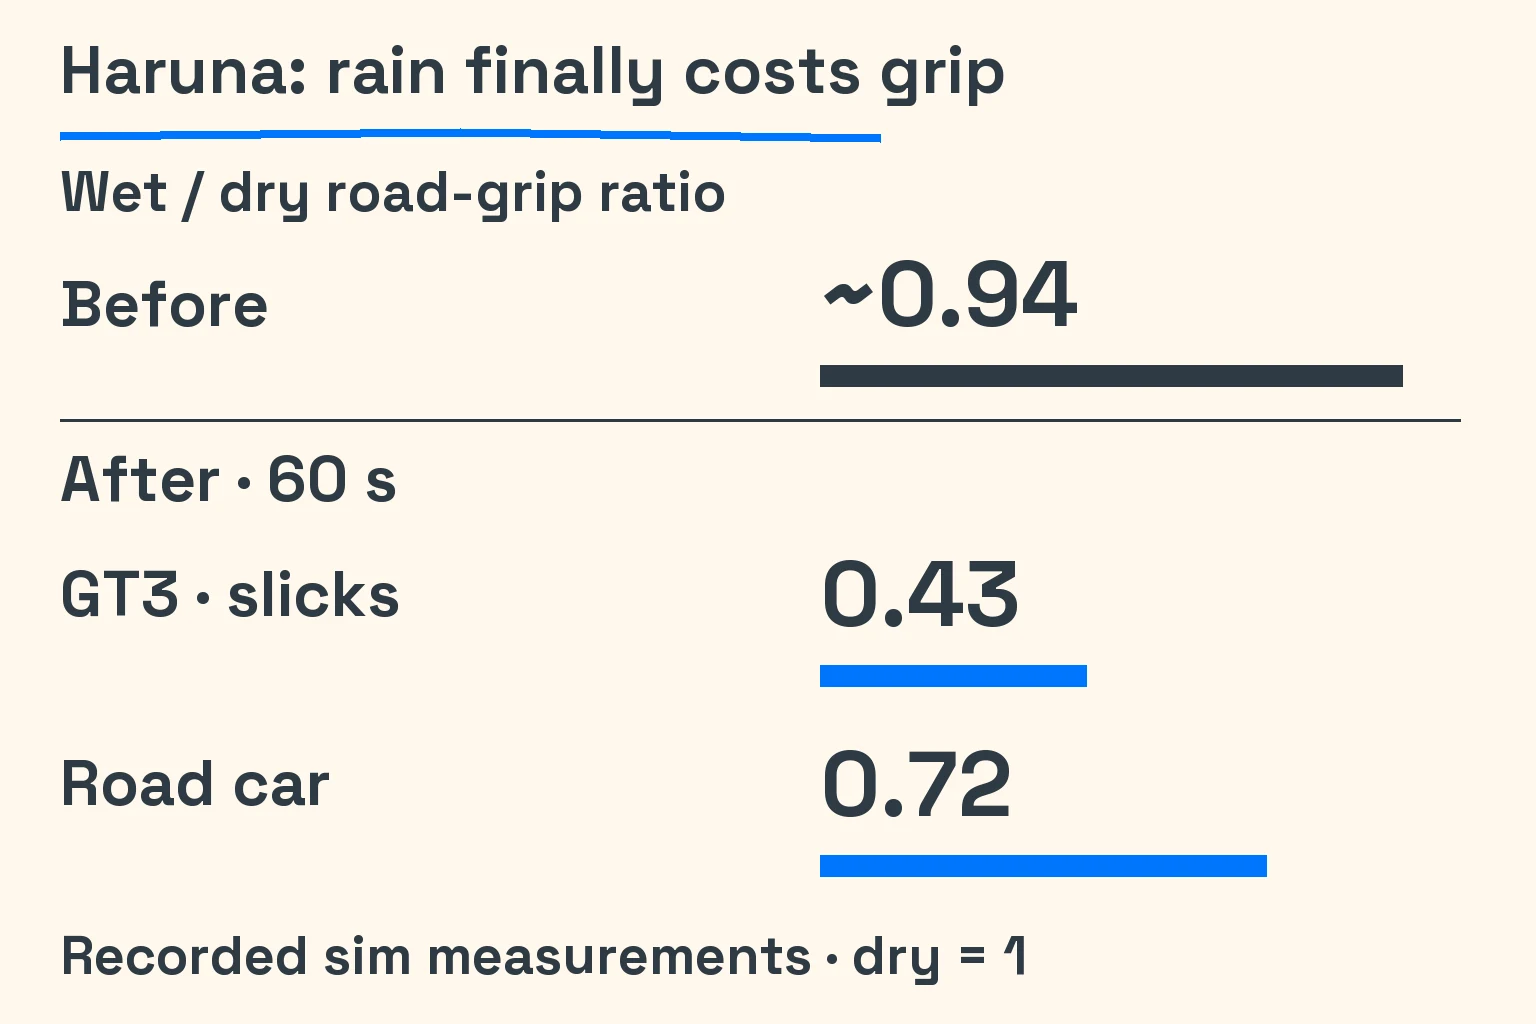
We build Seat Time, our browser driving sim, at AI Maker Lab with our crew of AI coding agents. In the second week of October 2026, rain on Haruna retained about 94 % of dry grip. Meanwhile, edge-case tests found a parked GT3 creeping about 80 mm a minute with its brakes released.
We wanted rain that changed the drive, and a car that stayed put when parked. Both problems hid behind plausible pieces of physics. Following the water explained the rain; following a tiny leftover force explained the creep. That same week, outside source checks also made us withdraw a tyre score we had given ourselves.
The home circuit gave us a convincing start
Our first rain model tracked water in individual road cells. Rain added water; drainage and evaporation removed it. The tyre model used the remaining film to change grip and estimate aquaplaning lift. By this week, player cars used that model in the day/night and dry/rain conditions.
On the home circuit, the early numbers showed a clear difference. The GT3’s stop from 100 km/h grew from 32 m dry to 42 m wet. Its skidpad result, measuring sustained cornering acceleration, fell from 1.49 g to 0.89 g. We had chosen rain at 50 mm/h and an initial water layer of 2 mm.
Those results answered a narrow question: could rain affect this car on this circuit? Haruna asked another one. Its measured wet road-grip ratio was about 0.94, meaning it retained about 94 % of the dry reference. After the changes below, the ratios at 60 s were 0.43 for a GT3 on slicks and 0.72 for a road car.
The useful comparison was the whole path from falling rain to available grip. Water could reach the road and the tyre correctly while the combined tuning removed most of its effect. We had to look past the presence of a rain feature and ask what survived at the contact patch.
Three ways to drain the rain away
The agents found three separate causes. Haruna’s 5–9 % grades drained the water film to about 0.2 mm. Every player tyre drained as though it had 6 mm of tread, including slicks. Then the surface-clearing pass removed about 45 % of the water per row, leaving the rear tyres a half-dry patch.
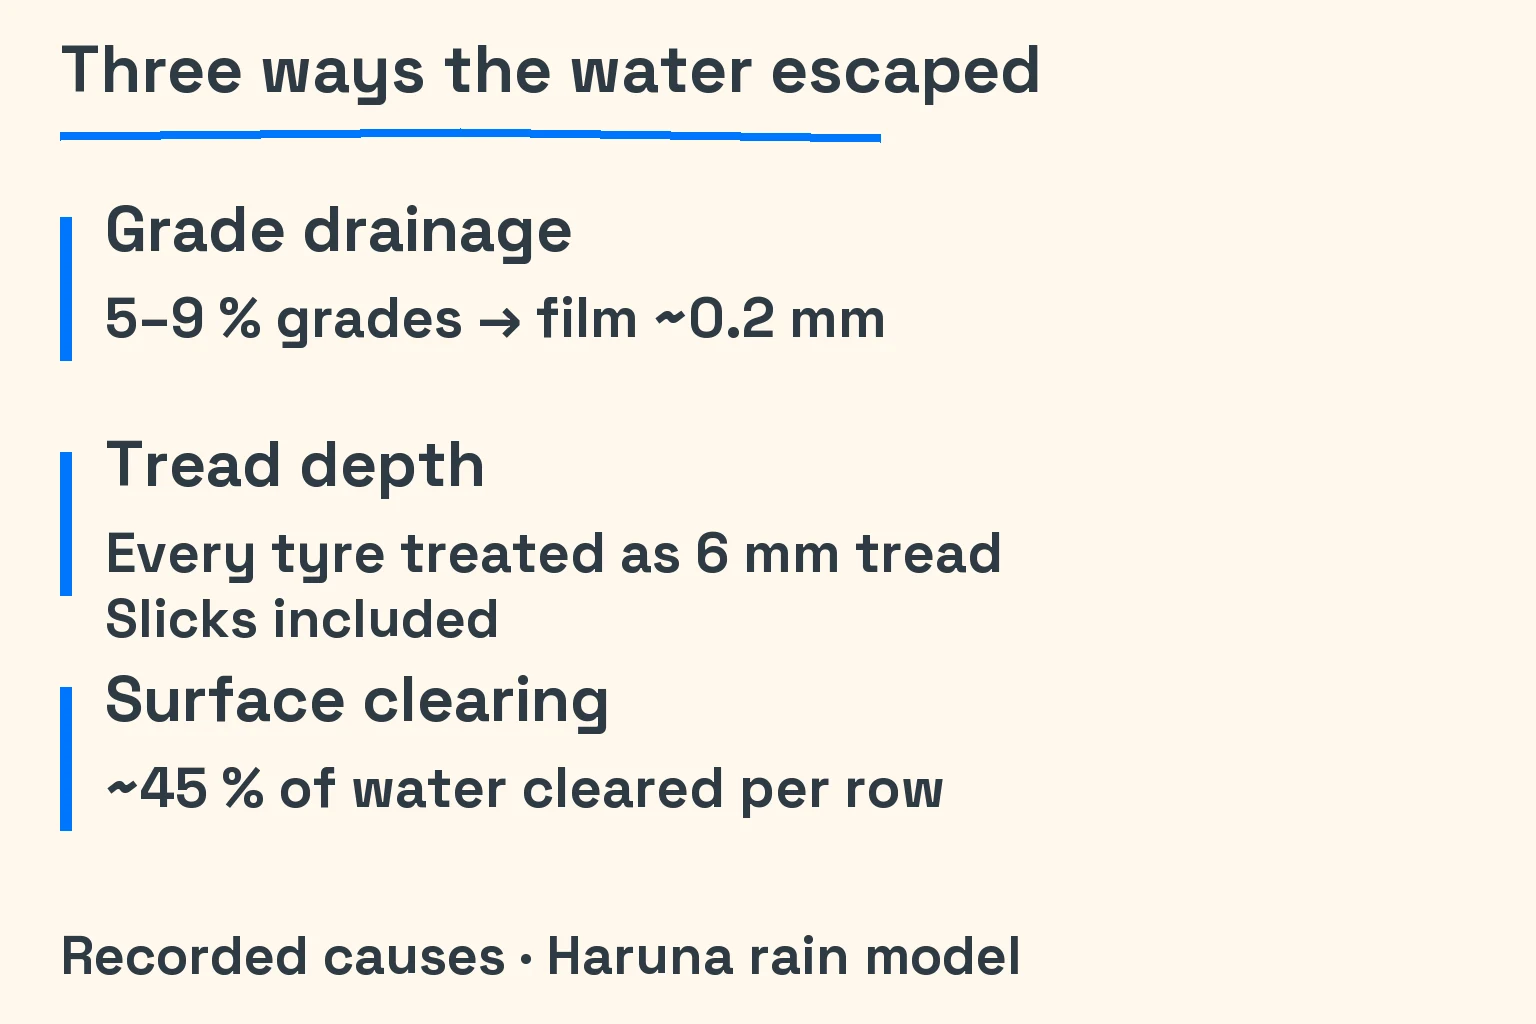
The shared tread value was especially revealing. We had used a wear-depth value where the water calculation needed a drainage depth. A slick had acquired the drainage benefit of a treaded tyre without acquiring any grooves. That made the same setting mean different things in different parts of the simulation.
The clearing pass compounded it. Water left by the front tyres mattered to the rears, so each wheel was not encountering an independent copy of the same wet road. Together with the slope drainage, those choices explained how a correctly connected model could leave Haruna so close to its dry grip.
We changed the tyre compounds’ wet-grip settings and gave slicks a zero groove depth. Road treads received their own drainage depths. The surface gained a separate damp state, a diagonal drainage path and gentler clearing under the wheels. The work followed the water through the system rather than multiplying every car’s grip by one blanket penalty.
Then we reduced the rain input to 25 mm/h and the initial water to 1 mm. Lighter rain produced wetter grip because we had stopped draining away so much of its effect. On the home circuit, wet braking distance from 100 km/h became 2.69 times dry. The wet skidpad result fell to 0.55 g, against 1.49 g dry.
These were useful changes to our model, but the rain remained a tuned approximation. We had no measured Haruna weather-and-road dataset to calibrate against. Even the reduction in wet grip with speed came later. The larger wet/dry difference brought us closer to the behaviour we wanted.
The parked car had a smaller problem
The creep came from edge-case specs, not a recorded player report. Cambered cars moved when parked; zero-camber karts did not. Camber is the wheel’s inward or outward tilt. Our tyre model still produced roughly 280 N of camber thrust per side on the stationary GT3. Most cancelled sideways, but toe angle and settling left about 0.7 N pointing fore-and-aft.
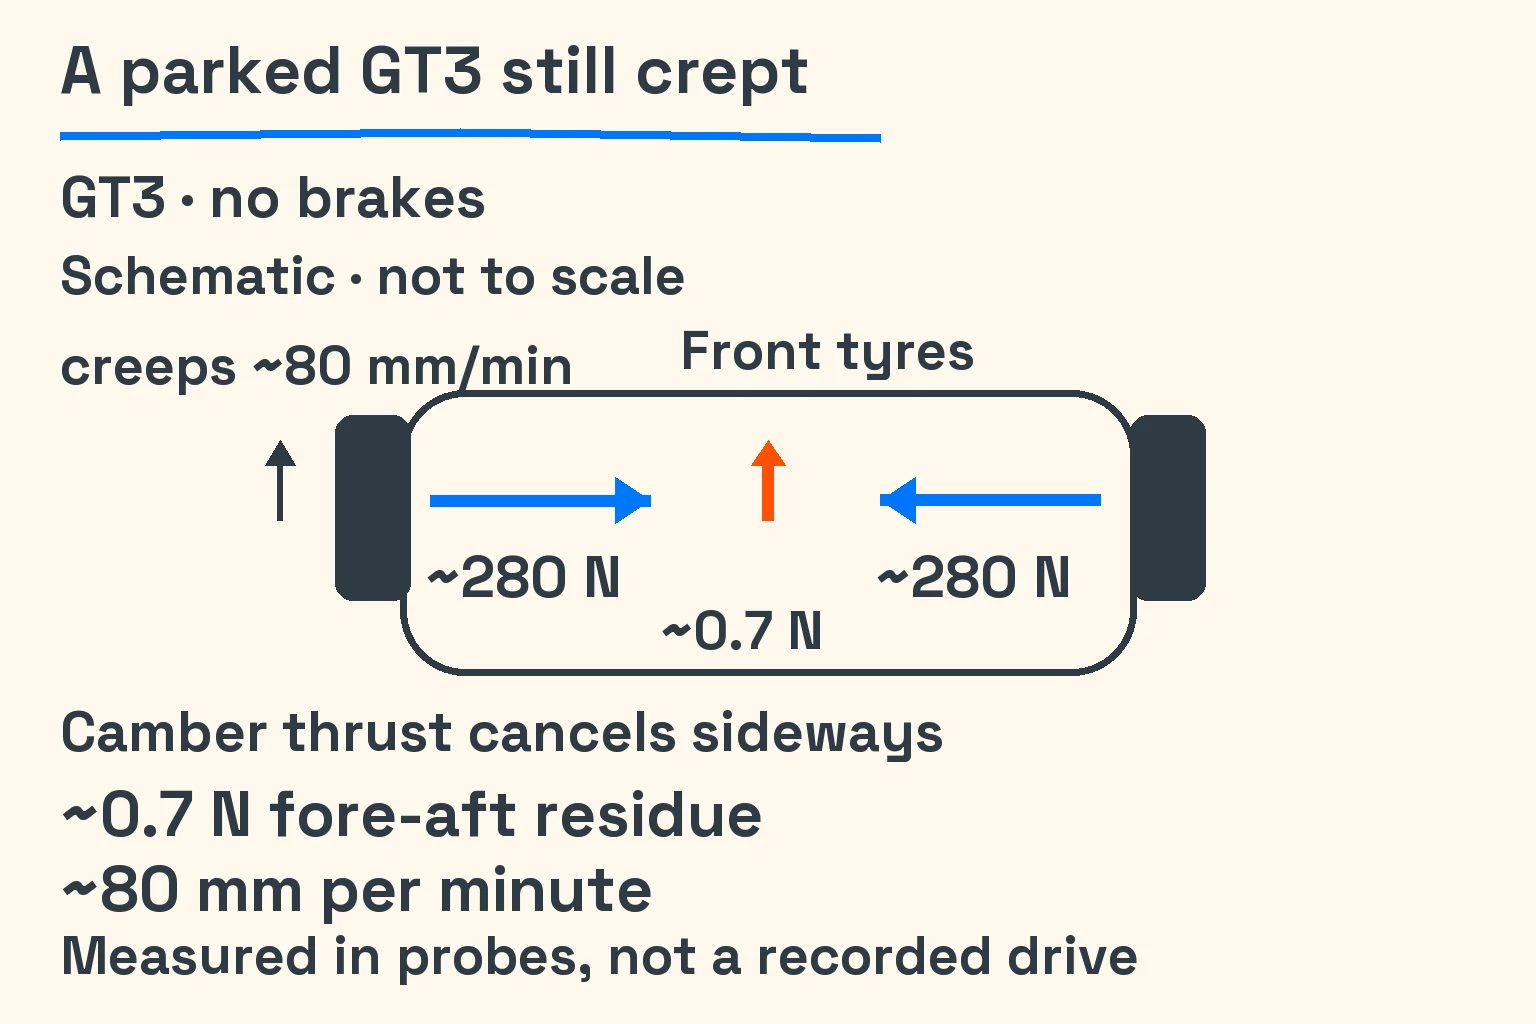
That residue was enough for roughly 80 mm of movement per minute. Our low-speed rolling resistance was viscous: its opposing force depended on movement. It could resist motion, but it could not hold that small force at rest. Waiting for the car to slow down would not solve the missing hold.
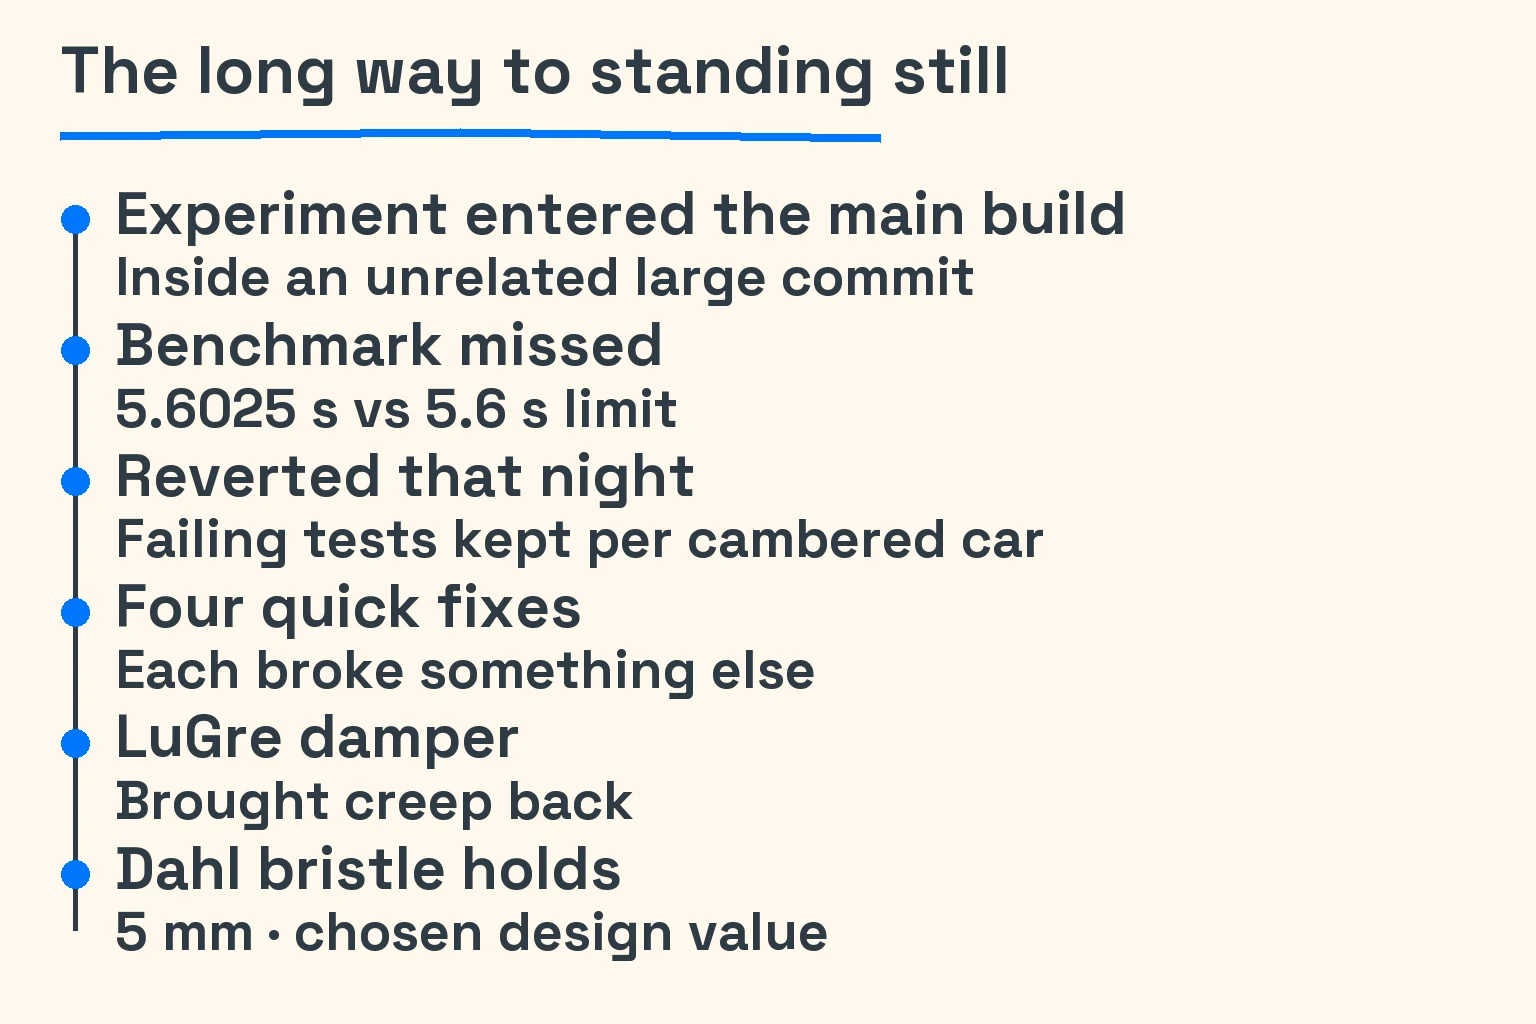
An agent’s in-progress camber-fade experiment rode into the main build inside an unrelated large commit. We reverted it that night.
The experiment had moved the Tempest’s 0–100 km/h benchmark to 5.6025 s, outside its 5.6 s limit. We kept parked creep visible as a known failing test while trying alternatives. The sequence ended with a rolling-resistance change rather than another way to fade the tyre’s force.
Four quick fixes moved the trouble elsewhere
Fading camber thrust below 2 m/s changed the Tempest benchmark and required refitting stability-control constants. Restricting the fade to below 0.5 m/s still disturbed wet AI laps, stability-control fits and a barrier-crash test. The smaller range did not make the change local to parking.
A stick/slip resistance law, or a narrower transition band, disrupted split-grip checks, wet AI laps and the slip-energy accounting. Scaling the camber shift inside the tyre formula would have broken the player tyre’s established contract. Each approach could address the visible symptom while changing behaviour we were trying to preserve elsewhere.
Our proposed solution changed too. The earlier investigation suggested making camber thrust build with rolled distance. What we actually shipped addressed rolling resistance instead.
A bristle could hold without erasing camber
We used a Dahl bristle model for rolling resistance. Think of a small elastic bristle that deflects and holds a load before sliding. Unlike resistance based only on speed, it can retain an opposing force at rest. We capped that static hold at asphalt rolling resistance, rather than letting it become an unlimited parking brake.
The bristle length was 5 mm, a chosen design value rather than a measured tyre property. Grass and gravel kept their viscous behaviour. The published starting point was P. R. Dahl’s 1968 Aerospace Corporation report, A solid friction model.
We also tried the bristle damper associated with LuGre, described by Canudas de Wit and colleagues in A new model for control of systems with friction. In our implementation, tiny oscillations ratcheted the bristle state and brought the creep back. We dropped the damper.
By the rain-and-creep fix, “does not creep when parked” was a plain passing test for all 19 cars. The improvement was modest to describe and important to keep: a parked car could stay parked without removing camber thrust to get there.
Outside data took away a score
Our first external checks withdrew a provisional tyre score. The tyre parameter file supplied with MFeval turned out to be an unattributed OptimumT example; a same-named OpenTire copy had different coefficients. MFeval is useful, BSD-3-Clause software, but its software licence did not establish that this example was measured data for our tyres. We could no longer use it to support that score.
The wind tunnel gave us a firmer reference. Cranfield’s DrivAer hp-F research and datasets, released under CC BY 4.0, offered measured aerodynamic forces. Comparing our simulation of the DrivAer reference vehicle with those measurements checked its aerodynamic model; our game cars remained analogues of that test vehicle.
The yaw results exposed a limitation in our formula. Yaw is the angle between the car’s heading and the airflow. Measured lift rose and changed sign, while our old expression could not follow that shape. We fitted an additive yaw-lift term; recorded residuals fell to 8–14 %, from 18–63 %. Because we fitted it, that improvement belongs with calibration, not an independent stamp of accuracy.
We also used DrivAerML as a comparison in the Lab. It is computational fluid dynamics, or CFD: calculated airflow, not a wind-tunnel measurement. Its dataset uses CC BY-SA 4.0 and stays separately attributed. Both sources were useful, provided we kept clear which one measured a physical model and which simulated one.
A measured engine was not our engine
Data from the US Environmental Protection Agency (EPA) and its vehicle-testing laboratory, NVFEL, gave us another anchor: the 2014 Mazda 2.0L SKYACTIV-G test package. Our validation reference matched held-out wide-open-throttle torque with 0.69 % root-mean-square error, a measure of overall discrepancy. That was encouraging for the reference calculation. Our MX-5 reference engine, however, was 17 % below the EPA torque at 1000 rpm under full throttle.
We then used EPA motoring-friction data to calibrate engine braking for 13 road-class cars plus the MX-5 reference. Motoring measures the resistance of an engine being turned rather than producing driving torque. Scaling that relationship by displacement gave us an outside starting point, but fitting cars to it was calibration. Independent validation of each car remained outstanding.
A newly run gentle trail-braking test still failed, and we left it failing rather than relaxing its limit. The useful outcome of sourcing was sometimes an improved fit and sometimes a clearer disagreement.
We declined members-only, non-commercial and otherwise restricted datasets when their terms did not fit our intended use. We found no suitable open large-slip tyre or suspension kinematics-and-compliance data for this work. Those gaps remained gaps; the game cars were still analogues of the measured vehicles.
Also that week, rain reached the glass
Rain beads moved from a flat camera plane onto the cars’ glass. That visual change had not been checked by eye. Ghost recordings gained actual brake input, and AI wheel and speed data fed spray, with some visual checks still unfinished.
On 12 October, a later weather change added keyframed rain, sun and wind that could dry the road along wheel tracks, while leaving the existing Rain setting unchanged. The road surface was becoming something the cars altered, not just a condition selected before a run.
Notes and sources
Measured — Our development records for 5–11 October 2026 supply the grip ratios, stopping and skidpad results, creep probes, benchmark times and model residuals above. The force diagram is schematic; the creep rate is a recorded probe, not a reconstructed time series.
Chosen design values — Rain inputs, initial water depths and the 5 mm bristle were tuning choices. Our interpretation — Following drainage explains the small wet effect; replacing low-speed resistance explains the hold at rest. Neither establishes real-road accuracy.
Not yet driven — The combined rain-and-creep fix was not browser-verified, and we have no recorded wet drive after it. This article was written with AI assistance from our development records.
Sourced facts — Friction references: Dahl’s 1968 report above and Canudas de Wit et al., IEEE Transactions on Automatic Control 40(3), 1995. Cranfield references: Rijns et al. on yaw and cornering, with datasets 25715547, 25721697 and 5833875, CC BY 4.0. No Cranfield data is redrawn in our figures. The earlier configuration is documented by Soares et al. (2018).
Sourced facts — EPA NVFEL benchmarking and test packages include the 2018 release of the 2014 Mazda 2.0L SKYACTIV-G Tier 2 fuel data, public-domain US federal work. DrivAerML is CFD under CC BY-SA 4.0. MFeval’s BSD-3-Clause licence covers its software. These citations imply no endorsement by the researchers, institutions or manufacturers.
Open Seat Time, pick Haruna, set Rain in the Conditions panel and compare a slick car with a road car.
Our next idea is to keep measuring against things outside our code, car by car.
Previous: Building places to drive · Next: It outgrew its name