
Drift, and the AI driver that found the shortcut
In Seat Time, our browser driving sim built with AI coding agents, we trained a small driver to test drift lessons. It passed Link Cedar Basin in 70% of its offline runs. Then we looked at how it was earning those passes: shallow slides, with the rear tyres still partly gripping.
That was the useful result of the week of 26 October 2026. Our learned driver had exposed a gap between passing the course and doing the drifting we meant to reward. The driver was a small neural policy, not a language model. The scoring question remains open.
The rear tyres let go too far
The drift lessons had arrived earlier in October: donuts, a figure eight, initiation, and the linked Cedar course. A hand-tuned scripted driver demonstrated them. We wanted a second way to ask whether those lessons were fair, beyond proving that our own script could pass them.
First, though, the car needed attention. The recorded complaint about the drift-kit Sable S1 was that wheelspin removed almost all sideways grip. The tail snapped round. The report doesn't identify who drove it, so this isn't a recollection of our own wheel session.
The tyre's peak grip wasn't enough to explain that behaviour. A drift asks it to keep producing sideways force while also spinning. Our combined-slip calculation—the part that handles both demands together—lost too much force beyond the peak. Increasing the peak would have hidden the question we actually needed to answer: what happens after the tyre starts sliding?
A spinning rear kept more side force
We replaced that sag with a brush-model sliding envelope: a shared limit for the forces a sliding tyre can produce. The recorded donut kick changed from 0.066 to 0.12 of the tyre's load as sideways force. That gave us a concrete difference to inspect, rather than a claim that the car now felt right.
The same work changed how grip responded to load. We chose a street-compound load-sensitivity value of 0.115, replacing 0.08, using the MFeval reference. The S1's peak-grip target remained tied to period road-test skidpad results of 0.84–0.85 g. Those were calibration choices and targets, not new measurements of a real S1.
The first sliding envelope removed a recorded 15–25% combined-slip sag. But it still depended on a high-speed sliding-friction source we had read too loosely. A source beside a number hadn't saved us from choosing the wrong conditions.
Our dry-road source behaved like a wet surface
The correction came from rereading TRL's comparison of motorcycle and car tyre friction. Its newly laid stone mastic asphalt had a bitumen film over the aggregate. The report explains that this can give a dry surface some wet-surface characteristics. We had carried that high-speed loss into our general sliding-grip model.
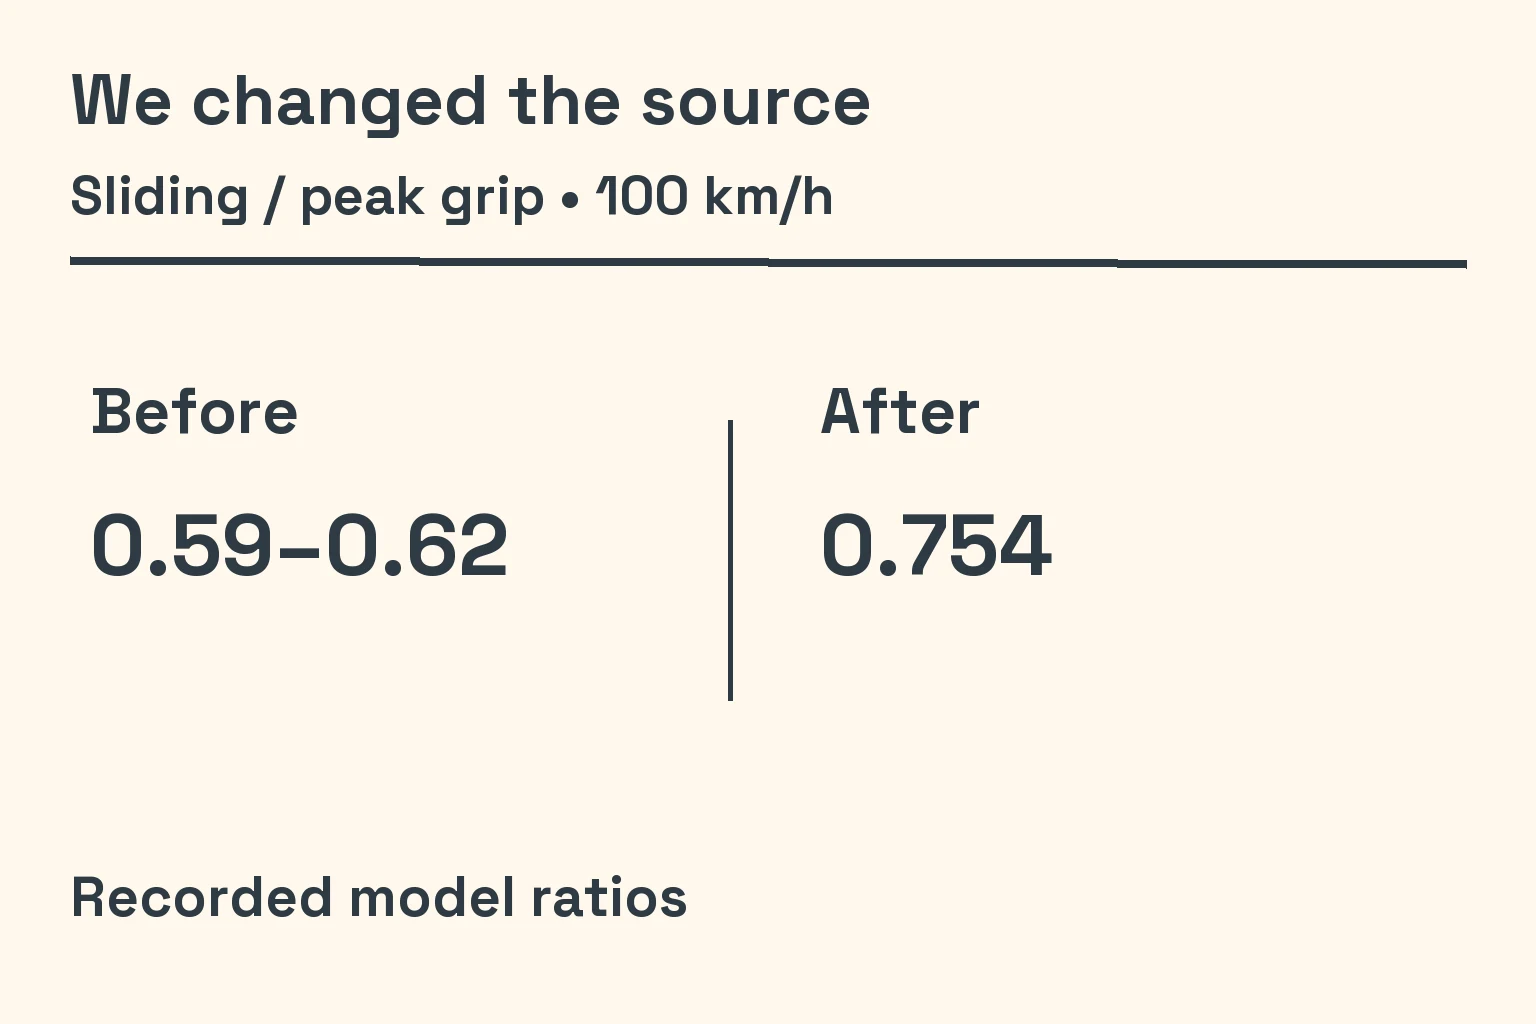
We instead used the report's hot rolled asphalt results. The retained engineering record gives locked-wheel coefficients of 0.76 and 0.73 at 32 and 100 km/h for the tested car tyre. Scaling that relationship into our model changed sliding grip at 100 km/h from 0.59–0.62 of peak to 0.754. The final value is our derived model ratio, not a number TRL measured directly.
That change also reduced the share of the validation envelope requiring extrapolation, from 1.35% to 0.87%. We hadn't loosened the reference bands to make the result pass. We had changed which road surface informed the sliding behaviour.
We removed a reversal, then put it back
The tyre correction contained its own reversal. The first pass removed the reversal of aligning torque, the tyre's twisting effect around the steering axis. Later comparison with independent reference fits required a reversal again, this time with a sourced magnitude.
At a slip angle of 0.5 radians, the S1's aligning torque went from zero to −0.389 of its peak. The comparison band was −0.498 to −0.191. Alongside the correction to how peak longitudinal slip changes with load, ten previously expected failures became passing checks. The point wasn't to make every tyre curve smoother; the reference sometimes required it to change sign.
Pressure and an old belt complicated the story
Pressure exposed another shortcut in our model. We had used an unsourced, symmetric penalty around 250 kPa. We replaced it with the pressure response from MFeval, and chose 200 kPa for the S1 from its US reference placard. Changing the curve moved other checks, so those disagreements needed investigation rather than wider acceptance bands.
The follow-through also found a tyre swap that kept the previous compound's belt properties. On the Ladybird with racing-soft tyres, lateral response lag was 2.46 times the intended value. The recorded result was a 1.6 Hz weave in roll and yaw, and a run that never reached 100 km/h. Correcting the stale properties let that minimum-tune case reach 100 km/h in 31.37 seconds.
These were separate faults with related symptoms. Together they changed the measured behaviour, but the drift-kit S1 changes have no recorded hardware drive yet. We can't turn a force ratio or an acceleration result into a steering-wheel verdict.
A little delay broke our demonstrator
The scripted driver couldn't settle whether a person could pass. Adding a 150 ms reaction delay made it fail two of three donut attempts and all three figure-eight attempts. Those small tests weren't a human study. They showed how much our demonstration depended on its control timing.
We had the coding agents train a separate driver with explicit constraints. It made decisions at 100 Hz, with a chosen 130–170 ms delay, limited steering and pedal movement, and correlated input noise. We used those as design values intended to make the probe less idealized. We didn't establish that they represented every human driver.
The policy had two small multilayer-perceptron heads, with 371 weights each. Training began by imitating the script using DAgger, by Ross, Gordon and Bagnell. That method collects guidance in states the learner encounters. We then refined it with the evolution-strategy approach described by Salimans and colleagues. Its objective combined the lesson score with a small reward for progress along the guide.
On the original lesson-car setup, the pad lessons recorded 89–100% pass rates. All those rates came from offline tooling, on noisy seeds: starting values for repeatable randomized test runs with input noise. They weren't player outcomes, and a higher score didn't establish that the driver was teaching the right technique.
The physics moved, so the driver had to learn again
A trained driver was tied to the physics it had learned. In the retained drift-kit comparison, donuts passed 88% of runs after tuning for physics 12. Moving those weights to physics 15 dropped the rate to 17%. Fine-tuning on physics 15 brought it to 100%, across the same set of 64 noisy seeds.
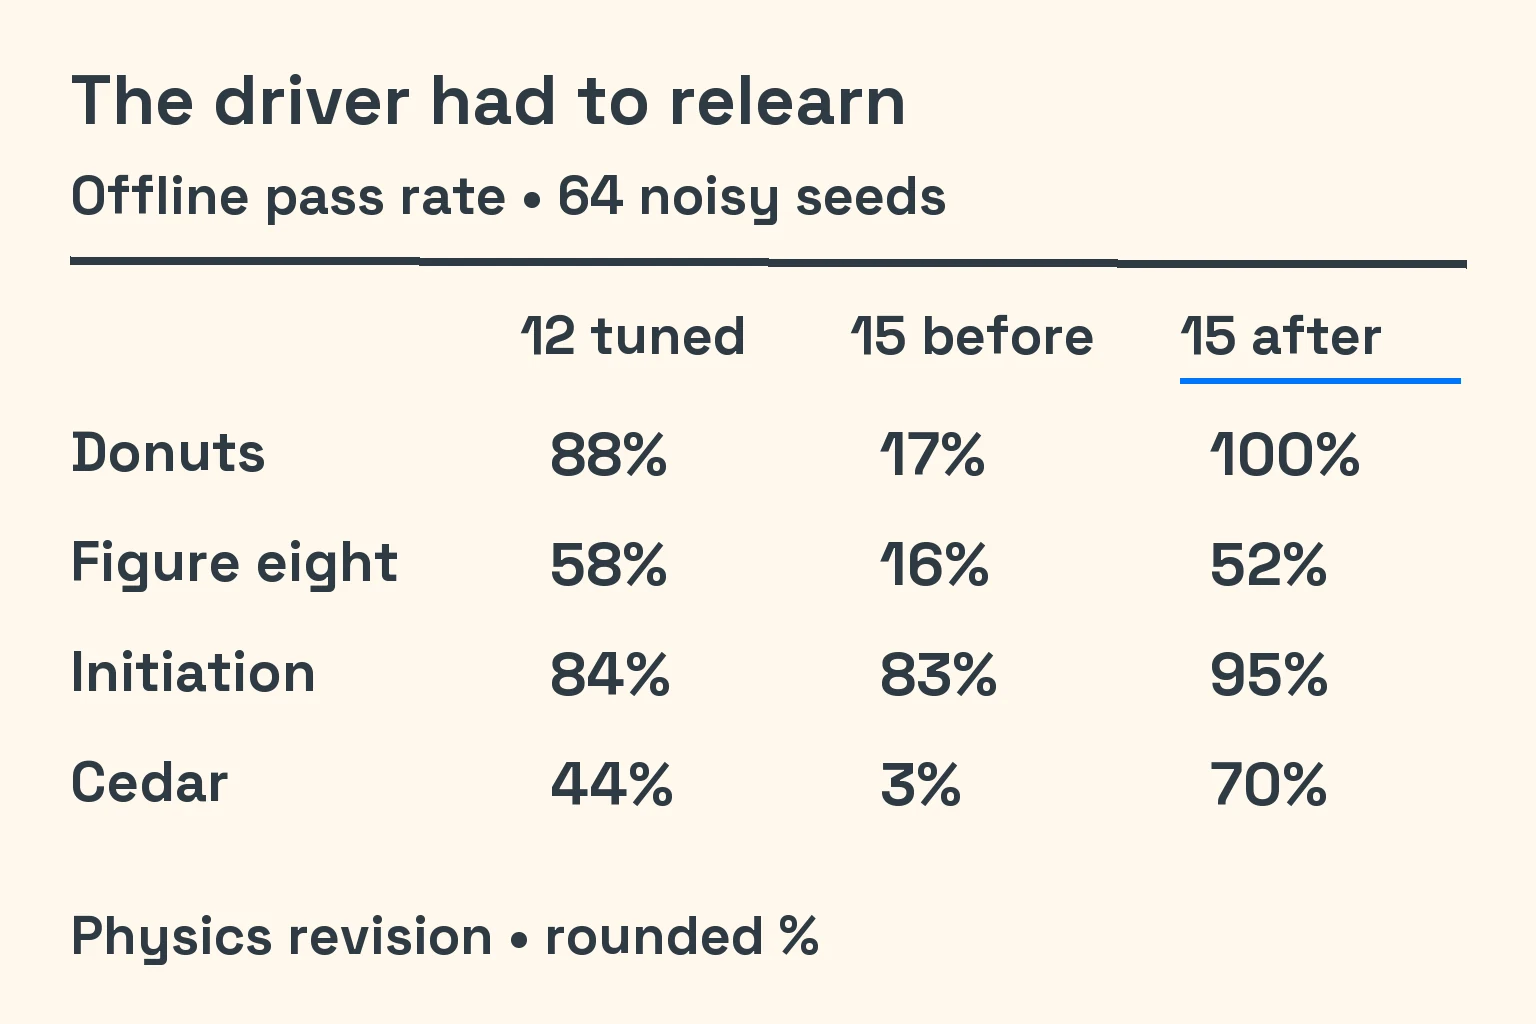
The figure eight didn't follow the same recovery. Its first physics-15 fine-tune passed about 52%; a later retry reached 41 of 64, or 64%. Yet the Watch demonstration kept the earlier checkpoint: its noiseless score was 56.21 rather than 49.93. The noiseless demonstration and the noisy pass-rate comparison answered different questions.
Cedar rewarded the shallow slide
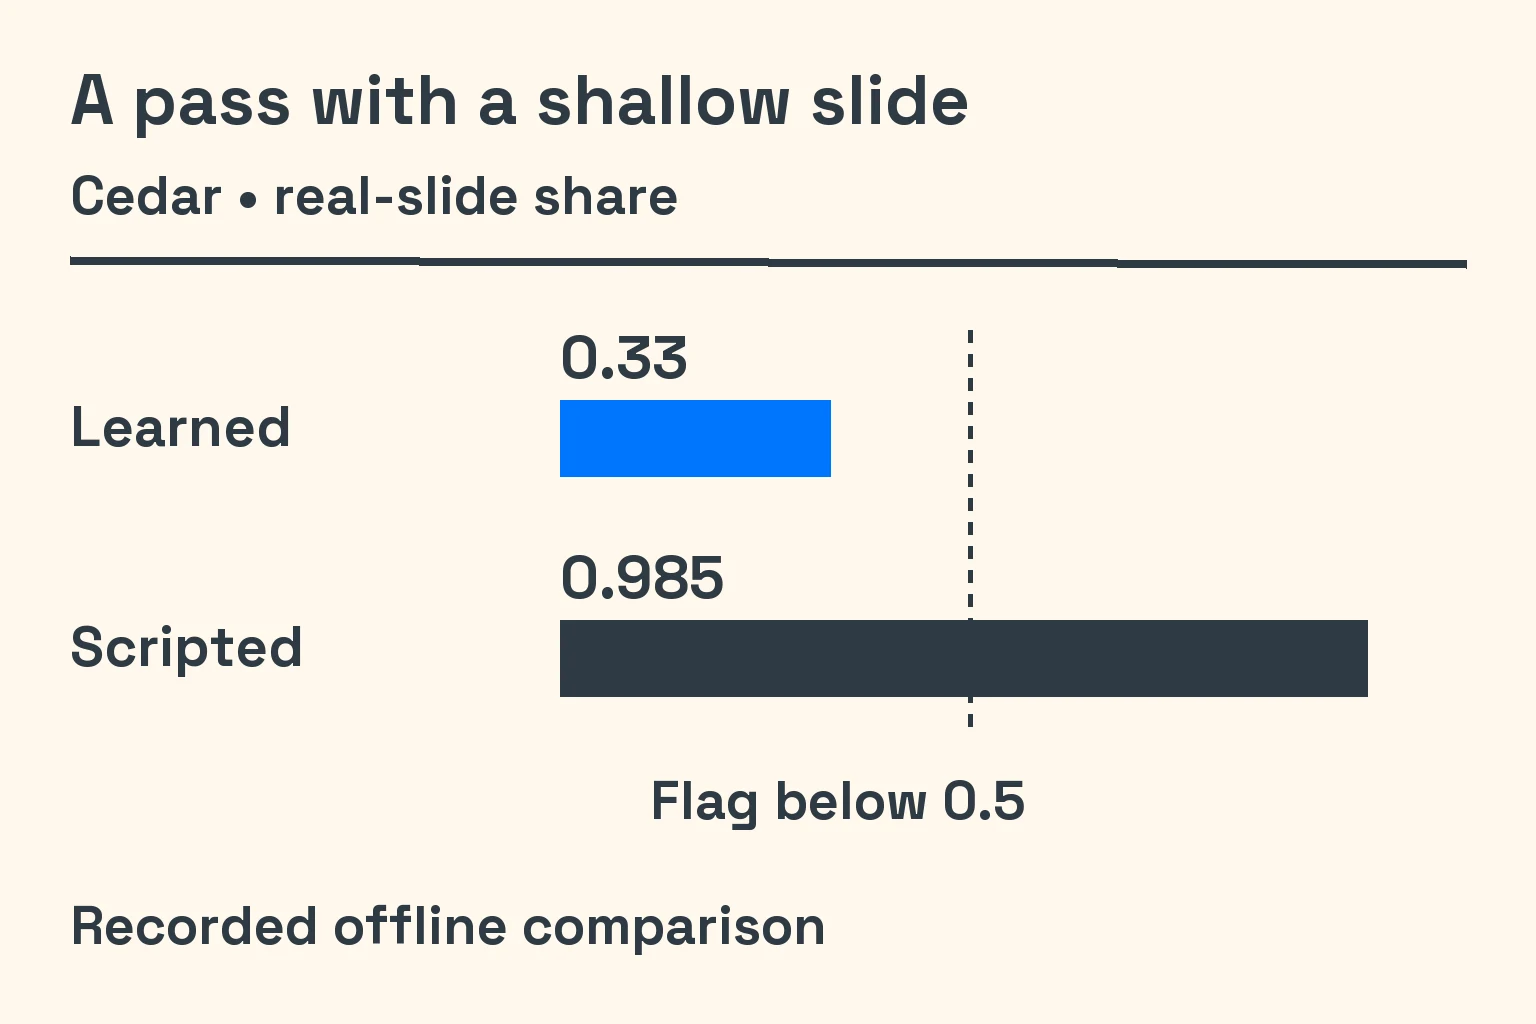
We added a check beside the score: during scored segments, how often was the rear axle actually at its limit? We called that the real-slide share. A scoring run below 0.5 was flagged for inspection. That threshold was our chosen diagnostic rule, not a universal definition of drifting.
Cedar made the distinction unavoidable. The physics-15 learned driver passed about 70% of runs, while 54 of 64 runs were flagged. Those are different counts: flagged does not mean passed. Its mean real-slide share was about 0.33; the scripted comparison was 0.985. The learner could satisfy the course with much shallower, partly gripping slides.
We kept the scripted driver in Cedar's Watch view so the demonstration showed the drift we intended. No scorer value changed as part of this work. The gap remains open; this article doesn't announce a fix or promise which scoring rule will change.
Our scoring claims had been wrong before
An earlier claim that grip driving earned zero points hadn't survived measurement. The figure eight awarded 4.84 points at 4 m/s and 3.81 at 7 m/s without the intended drift. We corrected that case and added a check requiring exactly zero. Cedar's shallow-slide result was a different, still-open question.
The course length had also been misreported. An earlier launch description said 718 m; the later correction recorded the live loop as 392 m. That same later account documented restoring the intended 650–800 m bounds after they had been changed to 350–500 m. With no suitable longer layout found, the unmet requirement stayed visible as an expected failure.
Even the differential had distorted the probe. Before the drift kit, old clutch ramps effectively requested 110% lock. The learned driver spent 31–66% of its slide time at at least 90% lock. A driver exploiting the simulated car can reveal a vehicle defect as well as a scoring defect.
A finished change still missed the shipped build
The learned driver also repeated an earlier release mistake: accepted work had landed in an intermediate development line without reaching the shipped build. A release check caught it, and the work was recovered. The Watch label was then made explicit about whether the learned or scripted driver was driving.
The useful result wasn't a clean pass percentage. We had a tyre model with traceable corrections, a probe sensitive to physics changes, and a scoring gap we could name. The missing pieces remained visible: no recorded hardware drive for these S1 changes, and no resolution of the Cedar scorer question.
Open Seat Time drift training, choose the figure eight, and use Watch; its label identifies the driver. Our next idea was to ask the same uncomfortable question across the physics suite: what does each passing check actually prove?
Previously: Grip is the rack going light. Next episode: Like-for-like, and the squat hunt.
Notes and sources
Measured — Retained build records supply the donut force ratio, extrapolation shares, aligning-torque comparison, belt-lag result, delayed-script failures, offline pass rates, slide shares, scoring corrections and course-length correction. The figures summarize those records; no historical simulation was rerun for this article. Physics numbers identify historical simulation revisions, not today's results.
Chosen design values — Load sensitivity 0.115, the 200 kPa pressure reference, 100 Hz decisions, 130–170 ms delay, input limits and noise, and the 0.5 inspection threshold belong to our model or test design. The reaction delay is not presented as a measured human norm. The period skidpad range is a retained calibration target, not a fresh verification of those road tests.
Sourced fact — Lambourn and Wesley's TRL PPR496, Comparison of motorcycle and car tyre/road friction, especially pages 8, 12 and 20, explains the surface distinction. Our 0.754 ratio is a derived calibration. MFeval by Marco Furlan provides a reference implementation of tyre equations, not validation of our whole car. DAgger and evolution strategies are the training-method references, not evidence for our pass rates.
Related surface work — Our retained wet-grip comparison changed the wet/dry ratio at 60 mph from 0.49 to 0.19. The full download of the cited NHTSA presentation of Calspan testing was unavailable during this article's source check, so we do not claim a fresh verification of its numerical range. For grass, the chosen coefficient changed from 0.55 to 0.47 to target a 0.37 g locked stop. Cenek, Jamieson and McLarin, Table 4, report 0.36 and 0.38 for dry rye-grass; their mean is 0.37. Neither reference represents every wet road or grass surface.
Our interpretation — The shallow-slide results expose a scoring gap, not player success or a guarantee of fair lessons. Hardware status — The drift-kit S1 changes and related surface changes have no recorded hardware drive yet. AI assistance — Coding agents helped build, source, measure and train; AI also assisted this article's research synthesis, writing and localization.